Dashboards and telemetry overlays without the clutter
Dashboards and telemetry overlays without the clutter: what the software does, which four readouts earn their place and where an overlay costs more than it gives.
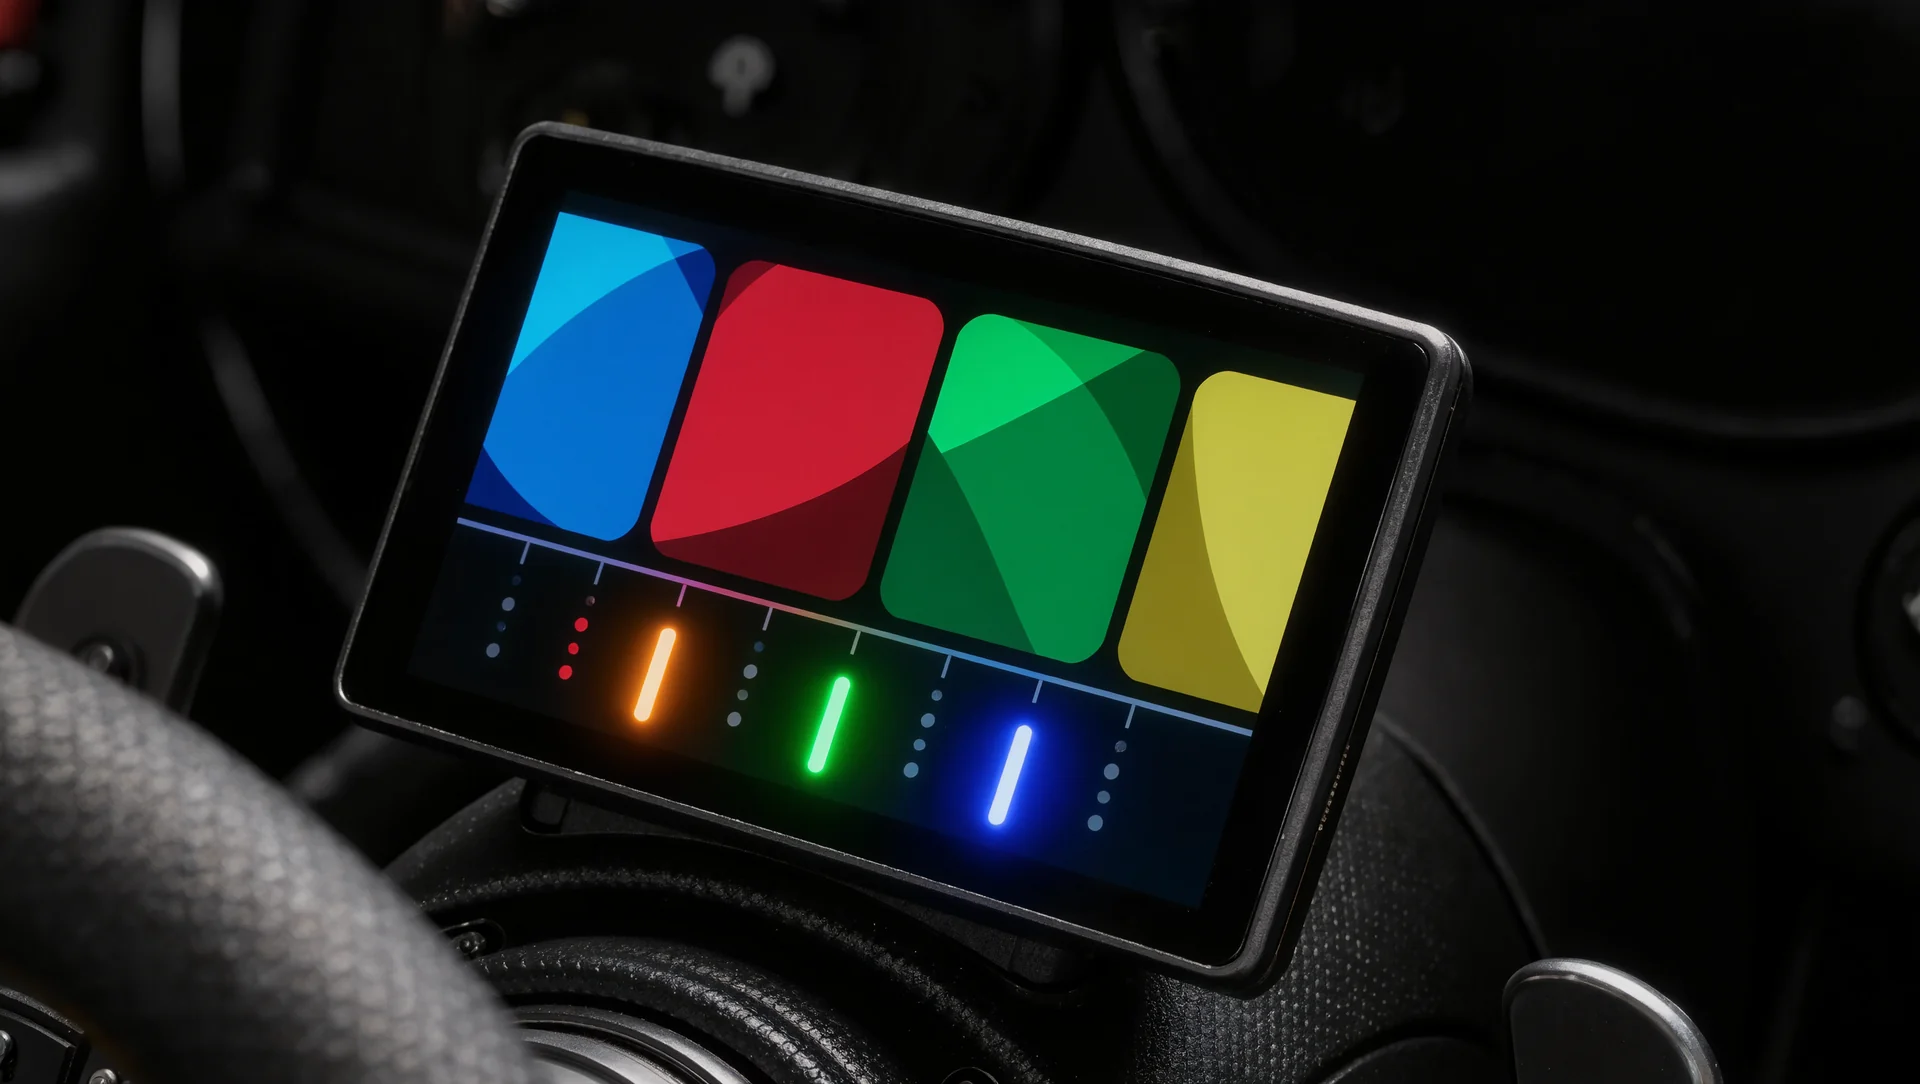
An overlay that shows twelve numbers shows you none of them, because at 200 km/h you have no time to read a dashboard. The useful question is not what a dashboard can display but which four things you will actually look at.
What the software actually covers
SimHub reads telemetry from a running simulator and turns it into output. Its published scope is broad: support for more than 80 simulations, around 100 games and roughly 200 devices, from button boxes and shifters to shaker motors, plus a no code Arduino integration for LEDs, seven segment displays and matrix panels.
The outputs fall into three groups. Dashboards and overlays on any PC or external display, showing gear, revs, delta, maps and flags; tactile output through controller motors, exciters or bass shakers with effects for ABS, brake lockup, traction loss, kerbs and gear changes; and direct control of haptic pedal reactors and active shifters over USB.
That breadth is the argument for keeping the whole chain in one program. A rig where the dashboard, the shakers, the wind kit and the LEDs all read the same telemetry source behaves consistently, while three programs reading the same simulator produce three slightly different pictures of the same lap.
The four readouts that earn their place
The delta to a reference lap is first, and it is the only one worth a large part of the screen. It answers the question you actually have while driving, which is whether the lap you are on is better than the last one, and it answers it continuously rather than at the line.
Fuel remaining in laps rather than in litres is second. Litres require arithmetic and laps do not, and the number you need in a race is how many laps you can still do rather than how much fuel is in the tank.
Tyre temperatures or pressures are third, but only as a colour rather than as numbers. You cannot read four numbers at speed; you can see that one corner has gone from green to red.
And the flag or session state is fourth. Whether a yellow is out, whether the pit lane is open and how long remains are all things that change your decisions immediately, and they are the readouts most often buried under lap times.
| Item | Figure or choice |
|---|---|
| Simulations supported | more than 80 |
| Games supported | around 100 |
| Devices supported | roughly 200 |
| Readout one | delta to a reference lap |
| Readout two | fuel remaining in laps |
| Readout three | tyre state as a colour |
| Readout four | flag and session state |
| Leave off | anything audible, anything for the pits, fast moving numbers |
What to leave off
Anything you can hear or feel. Revs are audible, wheelspin is audible, and a rev bar in peripheral vision is useful while a numerical readout of engine speed is not. Anything a tactile transducer already reports at 5 to 200 Hz does not need a second channel on the screen.
Anything you would only look at in the pits. Lap history, sector times from three laps ago and the standings of the field behind you are all valuable after the session and distracting during it.
Count the reading time you have. At 200 km/h a car covers 56 metres per second, so a glance of 0.3 seconds is 17 metres of track driven without looking at it. 4 readouts at 1 glance each per lap is 68 metres a lap; 12 readouts is over 200 metres, which is more than a whole corner spent looking at a screen instead of the road.
And anything that moves fast. A number that changes ten times a second is noise; the human eye reads a colour change or a bar position far faster than a four digit number, which is why the best dashboards use fewer digits than the worst ones.
Where an overlay costs more than it gives
In frame time. Every overlay renders on top of the picture, and a machine already at its limit in a full field is a machine where an overlay pushes the physics thread meter towards its 16.7 ms threshold at 60 Hz. Test with a full grid, not on an empty track.
And in attention. An overlay in the middle of the screen sits exactly where your eyes should be at corner entry, and a driver reading a delta at turn in is a driver not looking at the apex. Put it low, put it small, and check it on the straight.
Sources
Frequently asked questions
How many things should a dashboard show?
Four. Delta, fuel in laps, tyre state as a colour and the session state. Everything else is for the pits.
Should I show revs as a number?
No. Revs are audible and a bar in peripheral vision is faster to read than digits.
Does an overlay cost performance?
It renders on top of the picture, so on a machine already at its limit it can push frame time up. Test with a full grid.
One program or several?
One. A rig where the dashboard, shakers and LEDs read the same telemetry behaves consistently; three programs produce three pictures of the same lap.
More in Technology
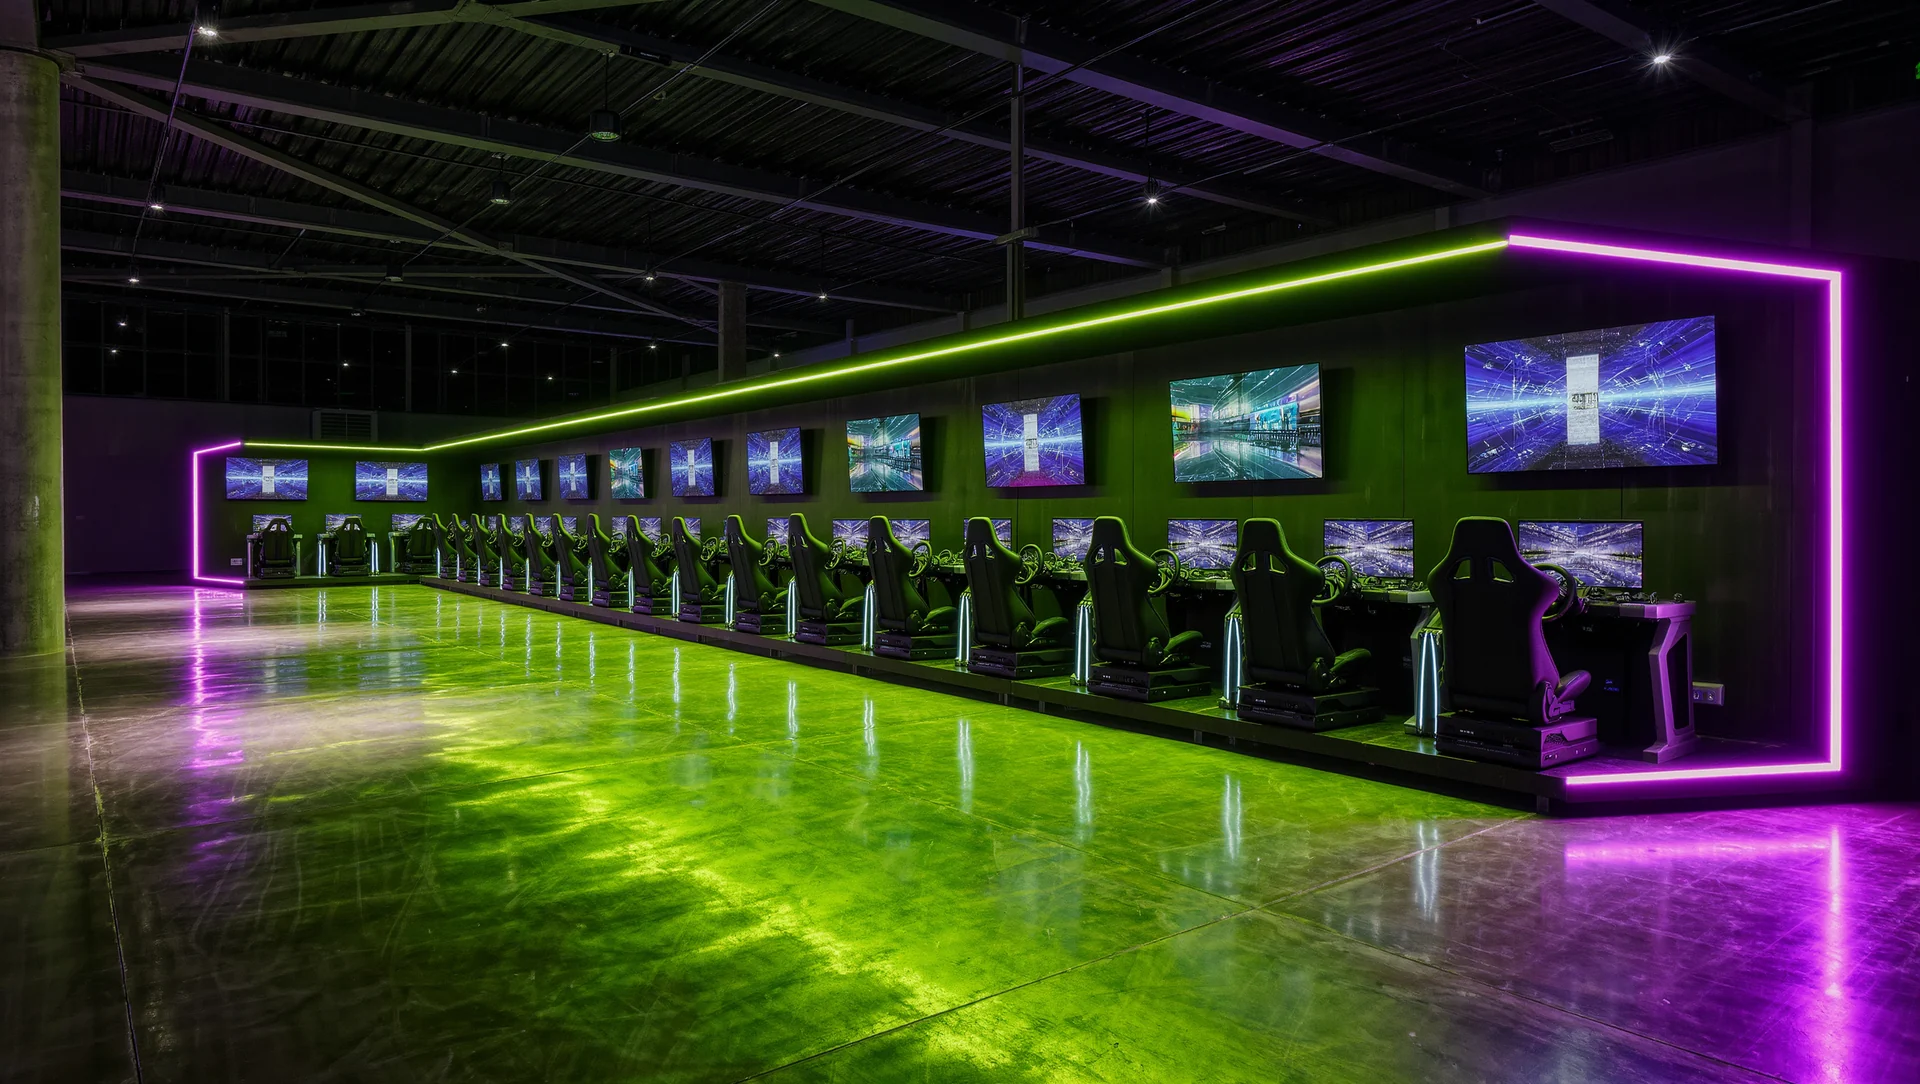
Opening a sim racing centre: the numbers before the dream
Opening a sim racing centre: the throughput arithmetic, the electrical and space requirements and the costs that only appear after the first month.
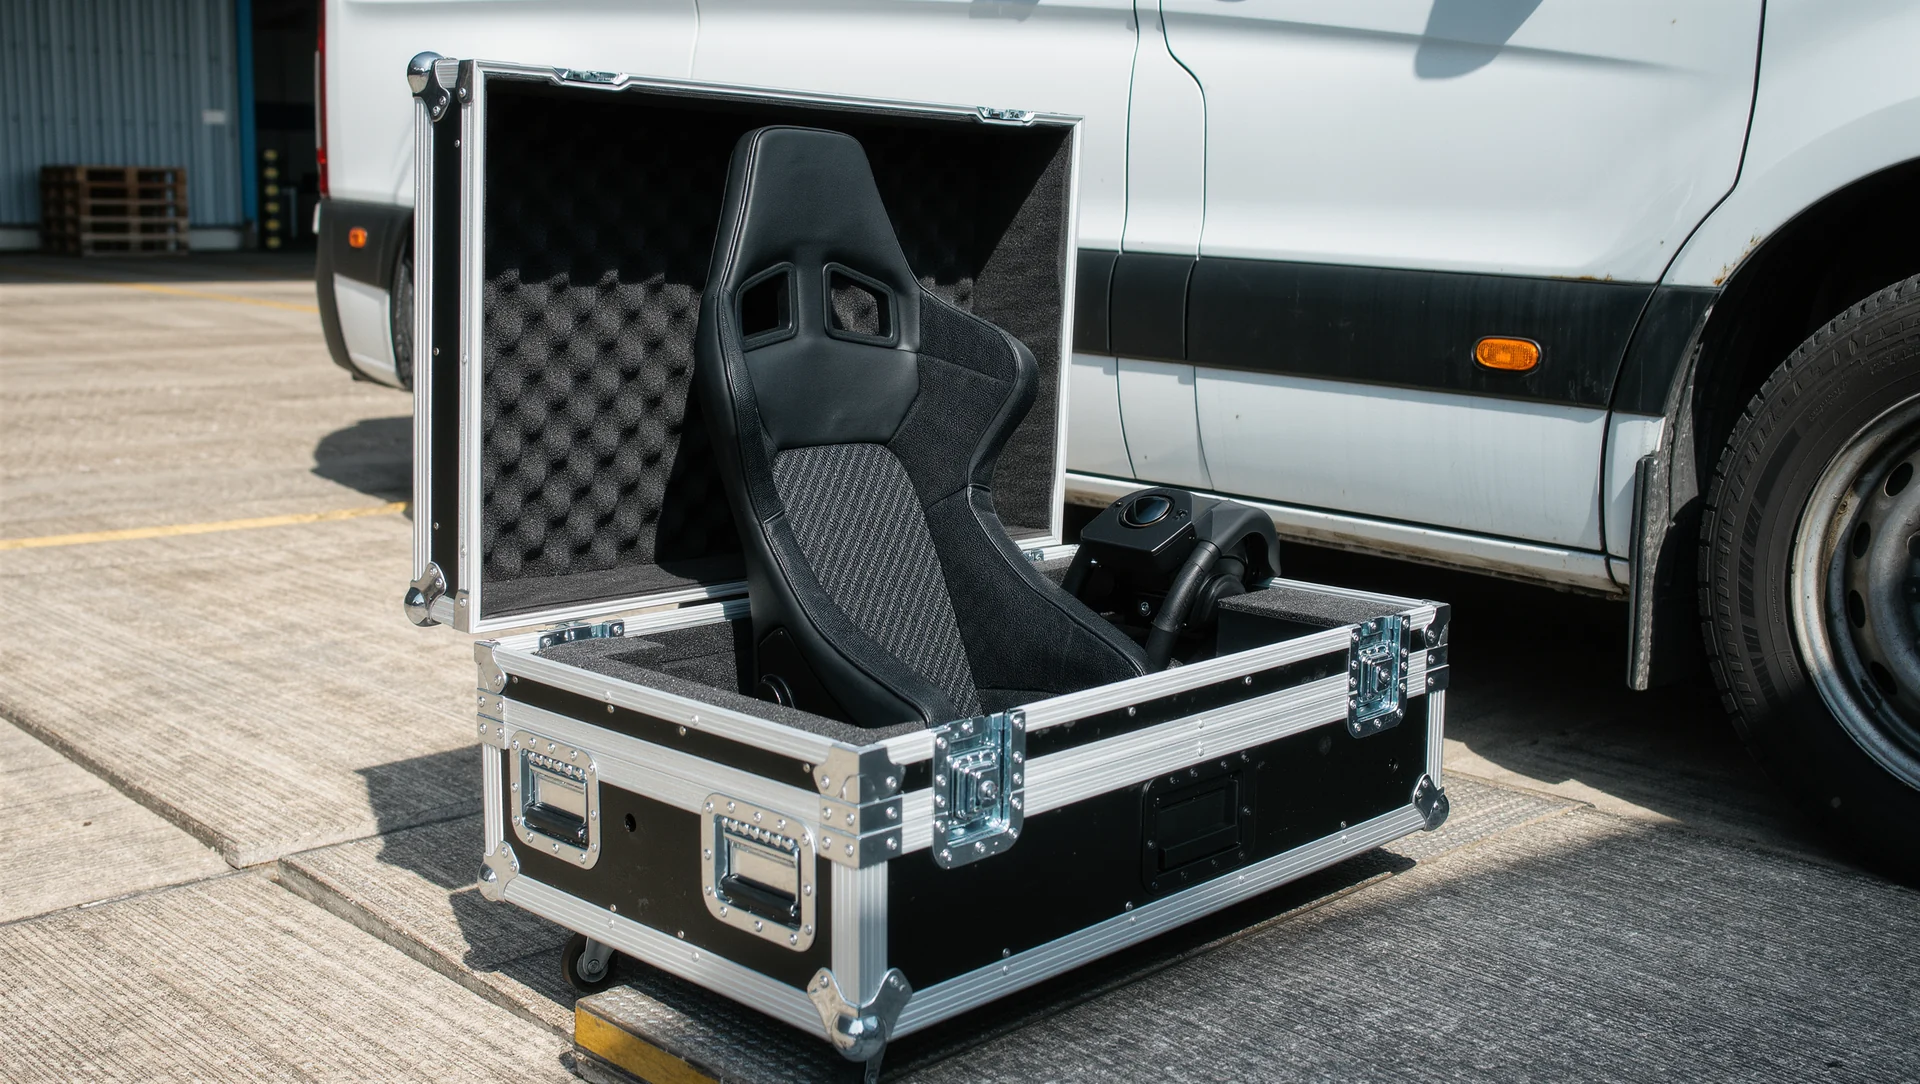
Simulator rental: logistics, pricing, damage
Renting simulators out: what a load actually weighs, how long a build really takes, how to price it and who pays when something breaks.
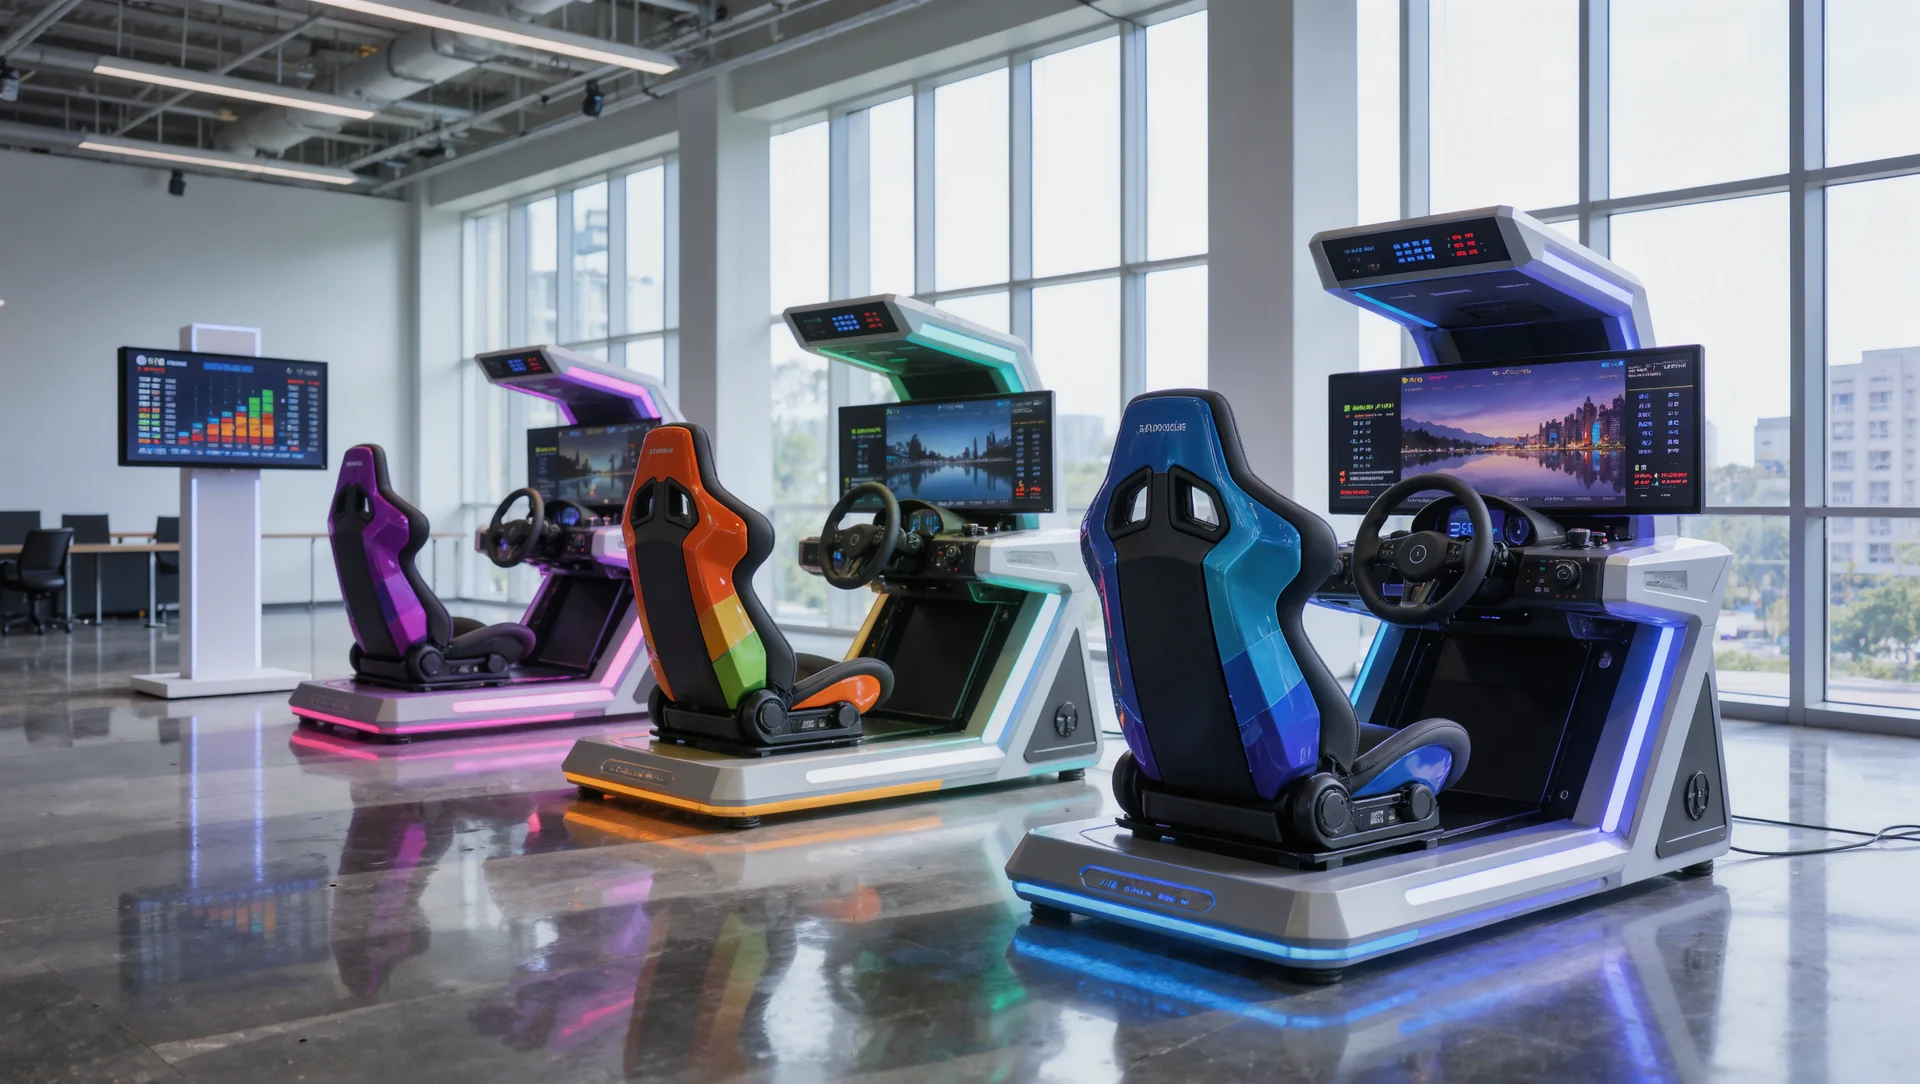
Corporate racing events that are not just a queue
Corporate simulator events that are not just a queue: the rotation arithmetic, the formats that include everybody and the mistakes that empty the room by hour two.